In our globally integrated world, asset allocation extends beyond local currency assets. Investors are increasingly turning to foreign currency assets as part of their investment strategies. This trend is driven by the potential for higher returns, diversification benefits, and the opportunity to capitalize on global economic trends. However, investing in foreign assets also comes with unique risks, particularly currency risk.
When considering global asset allocation, it’s crucial to analyze the performance of currencies in the markets you are investing in. This article investigates the historical performance of exchange rates to inform strategic asset allocation to global assets from the perspective of a U.S. investor in an ideal frictionless world (i.e., assuming no taxes, transaction costs, etc.)
1. Currency Performance Over the Past Decade
This graph illustrates the most recent 10-year average nominal currency performance relative to the dollar, for each sovereign in our selected universe.
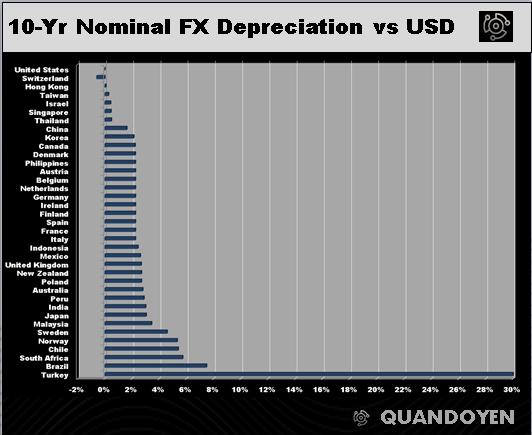
As shown, all currencies except the Swiss Franc have depreciated in nominal terms relative to the dollar over the past decade. The Swiss Franc’s appreciation can be attributed to its status as a safe-haven currency and Switzerland’s consistently low inflation rate. The depreciation of other currencies against the USD reflects a combination of factors, including differences in monetary policies, economic growth rates, and global economic events such as the 2008 financial crisis and the COVID-19 pandemic.
Our analysis does not aim to determine short-term tactical factors or long-run equilibrium dynamics. Instead, we focus on 10-year average historical returns, which roughly capture a full business cycle, helping us understand the structural dynamics at play for medium-term strategic asset allocation. In future posts, we will explore techniques for forecasting currency returns.
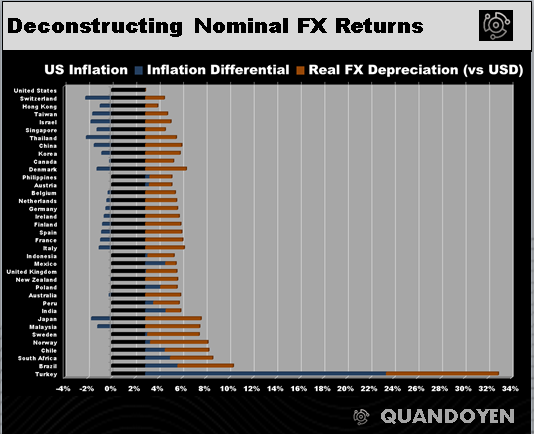
2. Deconstructing Nominal FX Returns
To better understand currency performance, we break down the nominal fx returns as follows:
Nominal FX Appreciation (vs USD)
= US Inflation
+ Inflation Differential
+ Real FX Depreciation (vs USD)
- US Inflation: The base rate against which other currencies are compared.
- Inflation Differential: The difference in inflation rates between the US and the foreign country.
- Real FX Depreciation: The actual loss in purchasing power of the foreign currency against the USD, after accounting for inflation differences.
The chart below shows that the historical 10-year US inflation rate is at 2.9% per annum. This serves as the baseline for comparing inflation differentials and real FX changes with other countries.