
It seems the Nordic giant Novo Nordisk has caught a nasty case of the blues.
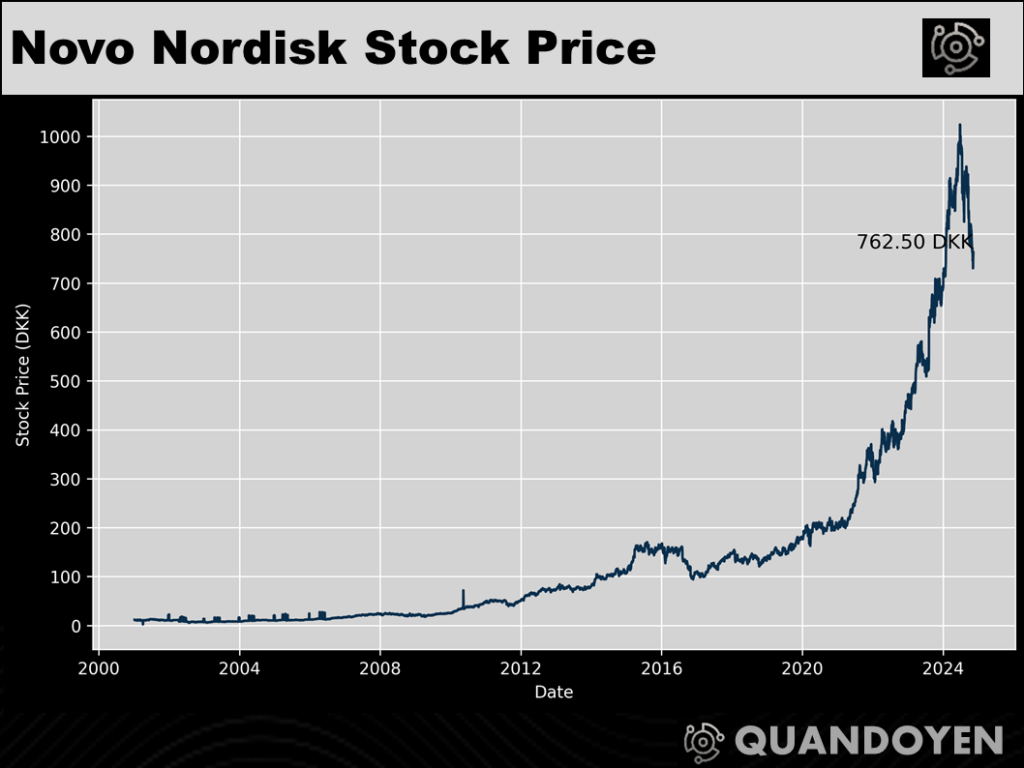
While crafting my previous missive on the Danish listed equities landscape, I couldn’t help but notice Novo Nordisk’s stock price had taken an unexpected tumble since June. As a preeminent player in the pharmaceutical arena, this downward trend intrigued me – what could be ailing this Nordic giant?
Upon closer inspection, the prognosis appears grim. Novo Nordisk is grappling with a host of concerning issues – from setbacks in its clinical trial programs, casting shadows over its product pipeline, to a heated battle for market share in the weight-loss drug arena, where scrappy upstarts like Eli Lilly have been making impressive gains. And to top it off, the company’s earnings report disappointed lofty analyst expectations, further fueling the negative market sentiment.
Despite Novo’s continued strength in core therapy areas like diabetes, the specters of fierce competition, pricing pressures, and clinical hiccups seem to be overshadowing these positives. The question is, has the market fully accounted for the risks facing this Scandinavian pharmaceutical giant? This is where the Merton model, with its unique ability to dissect both equity and credit risk, stands out as the ideal analytical framework. It’s time to don our Nordic sweaters and embark on a comprehensive valuation to uncover the true prognosis for Novo Nordisk.
Summary of the Series
In this captivating five-part series, I will guide you through a comprehensive valuation of Novo Nordisk’s assets using the renowned Merton model. Let’s take a closer look at what’s in store:
- Part 1: We’ll start by describing the general Merton model formula and calculate key equity-related inputs, such as the company’s market capitalization, stock price volatility, and dividend yield.
- Part 2: Next, we’ll examine the relevant aspects of Novo Nordisk’s debt schedule in detail.
- Part 3: Moving forward, we’ll estimate the appropriate risk-free rate spot curves for pricing the company’s bonds, as well as determine the risk-free curve to be used within the Merton model calculations.
- Part 4: In the penultimate installment, we’ll calculate the value of Novo Nordisk’s liabilities and identify the suitable term to maturity for our model.
- Part 5: Finally, we’ll bring all these elements together and implement the full Merton model, providing a deep dive into the results and their implications for understanding Novo Nordisk’s equity and credit risk profile.
Now, let’s unravel the inner workings of one of the Nordics’ most prominent pharmaceutical giants through the lens of the Merton model!
The rest of this article is available on Medium and Linkedin