As we dig deeper into Novo Nordisk’s financial health using the Merton model, it’s time to shine a light on the company’s debt schedule. In Part 1, we walked through the Merton model’s basics, focusing on equity value, volatility, and key inputs like market cap and dividend yield. Now, it’s all about liabilities.
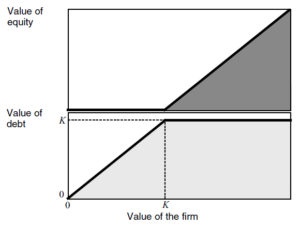
In the Merton framework, liabilities act as the “strike price” in the option-like equation of equity value. In plain terms, they stand between the company’s assets and its shareholders. Before we can deliver a full prognosis on Novo’s financial health, we need to carefully examine this critical component of its balance sheet. (Source: here).

This means we’ll be looking at both short-term and long-term obligations. The key question: how does Novo Nordisk’s debt stack up against its assets? And more importantly, what could that mean for the company’s credit profile?
Quick Recap of the Series
For those just joining our rounds, here’s your treatment schedule:
- Part 1: ✓ Complete! We’ve documented the patient’s basic equity metrics through the Merton model lens, capturing vital signs like volatility and market capitalization.
- Part 2: You’re here! We’re conducting a thorough examination of Novo’s debt structure.
- Part 3: Next up – we’ll calibrate our instruments by estimating the risk-free rate for bond pricing.
- Part 4: Following that, we’ll measure Novo’s liability values and determine the overall term to maturity.
- Part 5: Finally, we’ll synthesize all our lab results into a comprehensive Merton model analysis, combining all vital measurements into a clear diagnosis.
The rest of this article is available on Medium and Linkedin
